Excel has quick analysis tools for data visualization, a seriously useful tool when used with Microsoft Business Applications in today’s analytical world where the ability to visualize and consume data in order to make informed business decisions is of utmost importance.
Along with the fact that most accountants already know and use Excel, then this Microsoft wonder when used in conjunction with any of the Microsoft Business Applications, such as Dynamics GP and Dynamics Business Central can allow accountants to quickly send the necessary visualizations to management without hours and hours of coding.
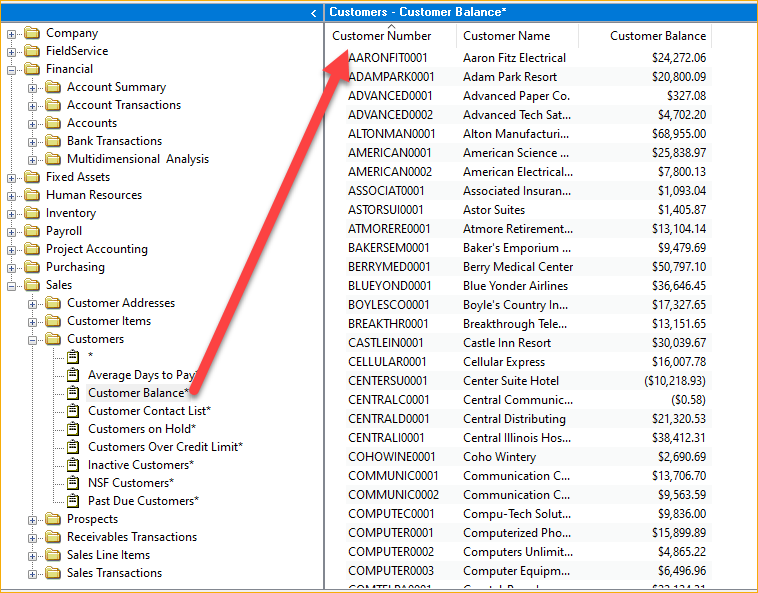
Let’s look at a scenario using GP and the CFO wants to see the customer running balances in order to implement new credit lines to customers.
We start by running a SmartList of Customer Balances and then shooting it out to Excel.
Let’s then simply highlight the data points and click the ‘Quick Analysis Tools’ button that appears.
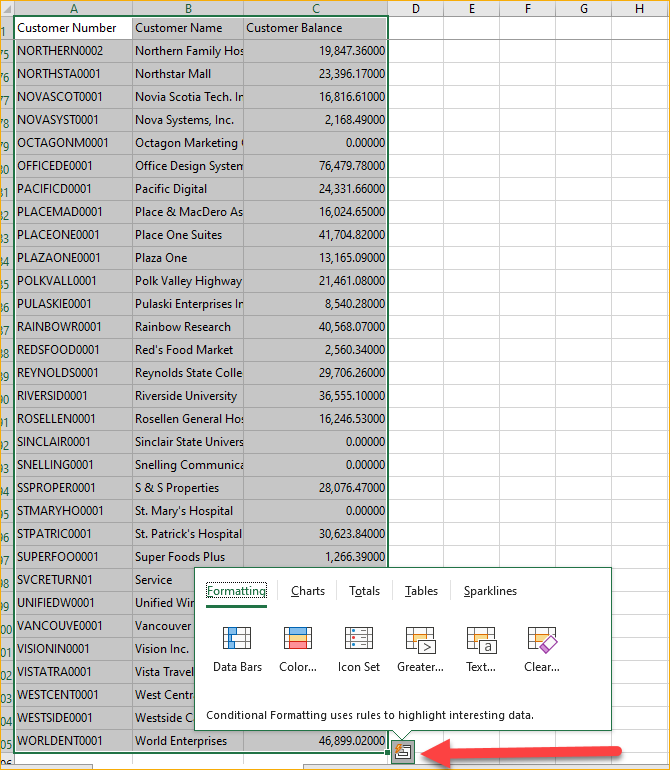
We can see pretty quickly that we can setup multiple types of analysis with just one or two clicks. We’ll look at some of these analyses using this same data-set:
DATA BARS:
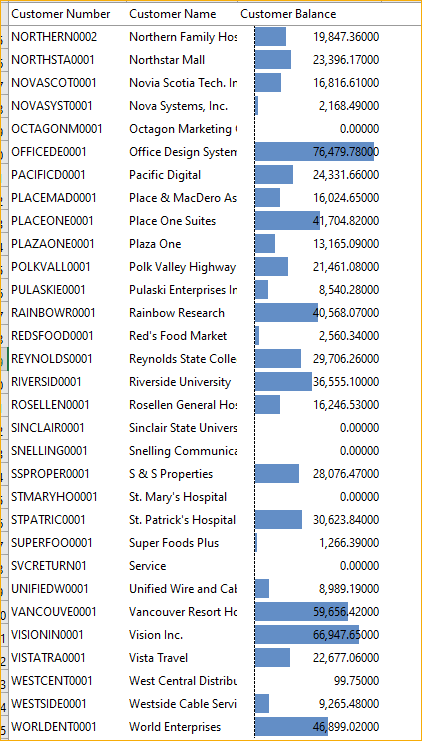
Look at that, an amazing visual of who has the highest and lowest running balance in my GP and it’s super easy to see as it lays over the actual amounts.
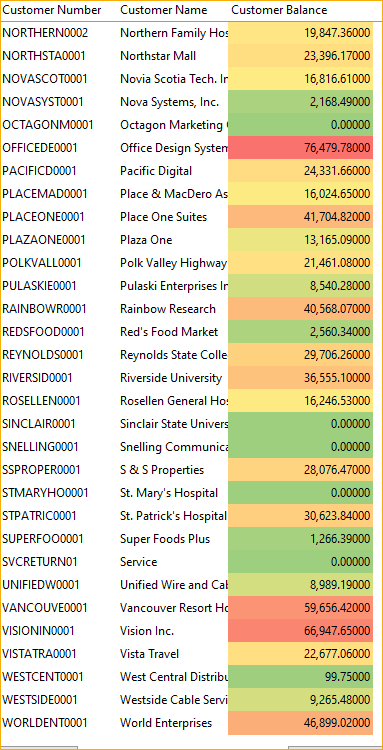
COLOR CODING
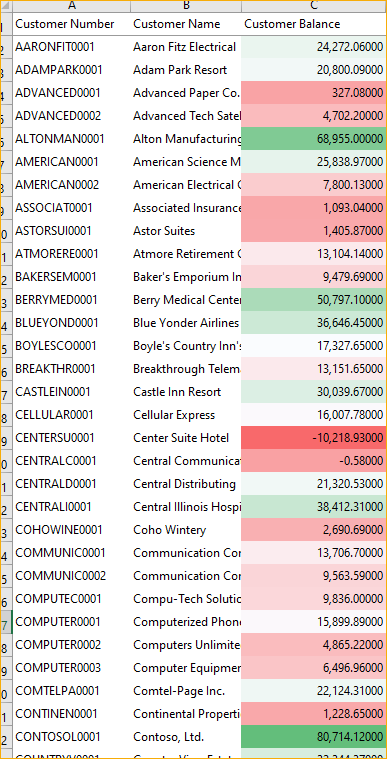
Not so much with the quick tools as it makes a high-balance green and a low balance red, but with this one I could go to the home tab and use the “Conditional Formatting” code to switch up the colors.
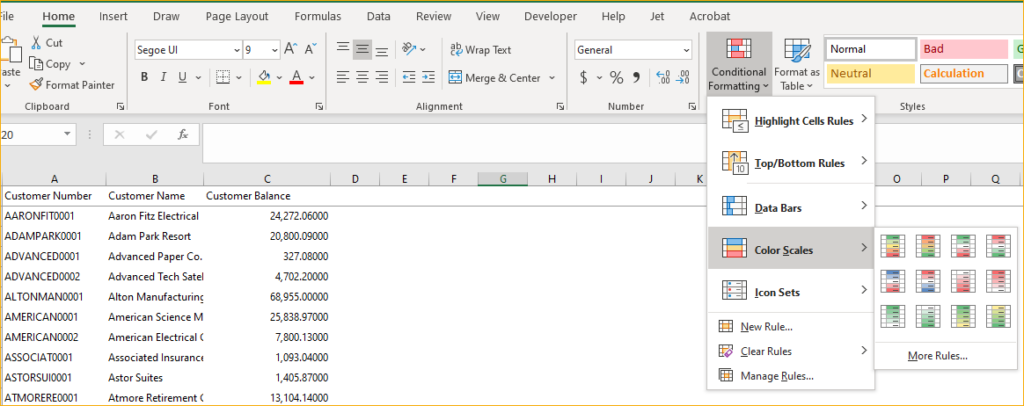
Ah, yes, this is better for my purposes:
Now there is a lot here, including the ability to quickly get an Average or a Sum (In the ‘Totals” option in the Quick Analysis Tools
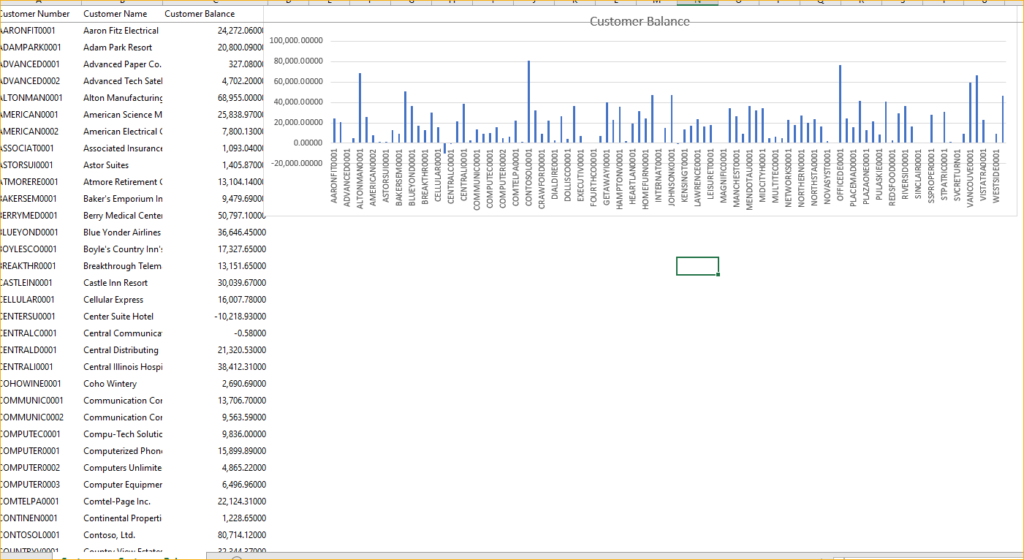
or I can create other tables or use Sparklines (play with these, they can be handy in some situations), but the other most useful for my analysis is the “Chart” Option.
the Chart Option will recommend the right chart for the job, but you can choose other chart types if you like, let’s look at the Chart Type Excel recommended for my data analysis:
CHARTS
So, depending on what you are trying to communicate, these Quick Analysis Tools can really come in handy.
Of course, here at Aisling we love reporting so if you have any questions on how to set up permanent reporting with these types of data visualization in Excel or Jet Reports or any other of the Excel Reporting tools built for Microsoft Business Applications, please feel free to reach out HERE.
To learn more cool Microsoft Excel data visualization tricks, please continue to follow us, but here are several other sites that can help spark ideas and creativity: